
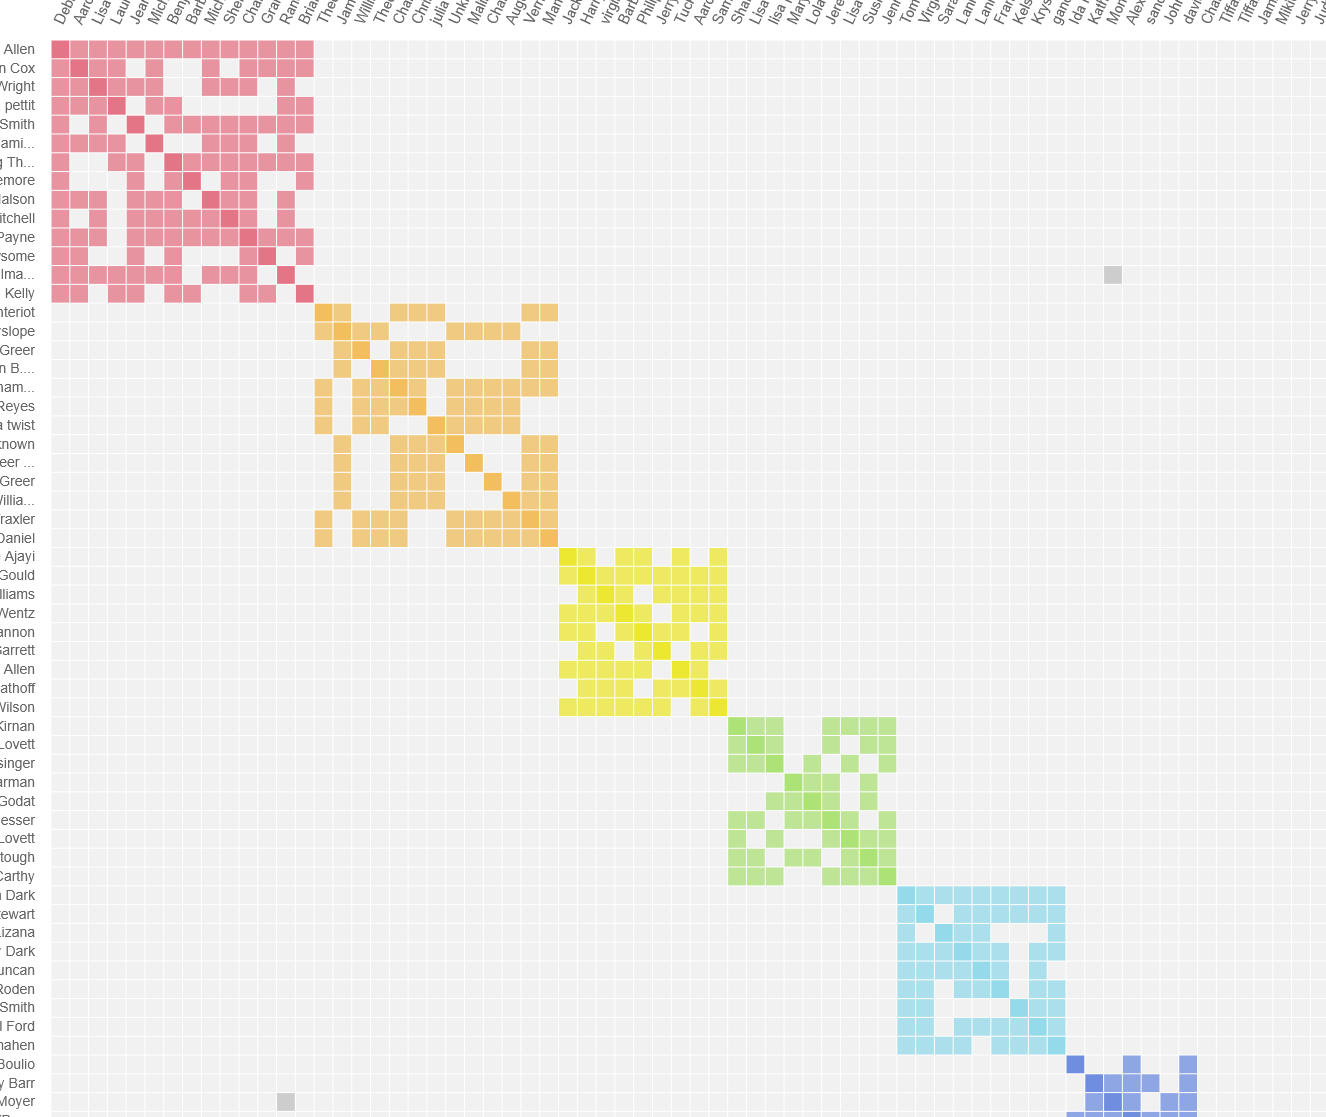
Every DNA test produces two things: a set of results, and a problem. The results are the matches — sometimes hundreds, sometimes thousands of other testers who share some portion of your DNA. The problem is figuring out what to do with them. Without a framework for organizing that list, most researchers find themselves either drowning in distant cousins or ignoring the match list entirely after the first few close relatives are identified.
DNA clustering, and the technique at its core known as the Leeds Method, is the framework that makes the match list manageable. It doesn’t require a chromosome browser or segment data. It doesn’t require that your matches have trees attached. It works, with varying degrees of precision, on every major platform. And once you understand the underlying logic, it is one of the most practically useful techniques in the genetic genealogy toolkit.
The Problem Clustering Solves
A DNA match tells you that you and another person share a common ancestor. It doesn’t tell you which ancestor, which side of your family the connection is on, or how many generations back you need to look. Faced with a list of, say, 400 matches between 90 and 400 centimorgans — roughly the second and third cousin range — a researcher has no obvious starting point.
The insight behind clustering is simple: matches who share DNA with you and with each other are likely to be on the same ancestral line. If Match A and Match B both appear in your match list, and Match A and Match B also match each other, the three of you almost certainly share the same common ancestor — even if you don’t yet know who that ancestor is. Group enough of these shared relationships together, and you get clusters: distinct groups of matches who all trace back to the same grandparent or great-grandparent line.
This method often creates four groups of DNA matches based on four grandparent lines — one cluster for each of your grandparents, in an ideal scenario. In practice, the number of clusters varies depending on your family’s genetic history, the size of the databases you’re working with, and the presence of endogamy in your ancestry.
The Leeds Method: The Original Manual Approach
The Leeds Method was created by Dana Leeds in July 2018 while she was working with a man who had experienced a major DNA surprise: his parents were not his biological parents. The method uses a spreadsheet to sort DNA matches into color groups based on shared ancestors.
The method focuses on matches sharing between 90 and 400 cM — roughly second and third cousins — specifically excluding very close matches (over 400 cM) who may share two grandparent lines rather than one, which would confuse the clustering.
The manual process works as follows: take your first match in that range and assign it a color. Then check each of your other matches in turn — if a match shares DNA with that first person, assign it the same color. Move to the next uncolored match, assign it a new color, and repeat the process, adding matches to existing color groups when they overlap with an already-colored match. The result is a color-coded spreadsheet in which each color represents a cluster of matches likely connected through the same ancestral line.
What makes this powerful is that it works even when matches have no family trees attached. The clustering logic depends only on shared match data — who matches whom — not on names, dates, or documented relationships.
Automated Clustering Tools
The manual Leeds Method is effective but time-consuming for large match lists. A number of automated tools now perform the same analysis algorithmically, producing visual cluster charts in minutes rather than hours.
Genetic Affairs AutoCluster is the most widely used automated tool, and has been licensed directly by both MyHeritage and GEDmatch to power their built-in clustering features. MyHeritage licenses it for custom clustering optimized for endogamy, and GEDmatch licenses it for custom clustering with unique segment analysis features.
AncestryDNA introduced its own native clustering tool as a ProTools feature. Ancestry’s match clusters provide a grid-based visualization of shared matches, and the company has announced plans to allow custom clusters with specific matches and cM ranges. This is a significant development since Ancestry has the largest DNA database of any platform — access to clustering within that database, without needing to export data, meaningfully lowers the barrier to using this technique.
Collins Leeds Method (CLM) via the DNAGedcom Client works across multiple platforms including Ancestry, 23andMe, FamilyTreeDNA, MyHeritage, and GEDmatch, producing color-coded cluster charts from downloaded match data.
Shared Clustering, developed by Jonathan Brecher, is another automated tool that produces detailed cluster visualizations and works with data exported from multiple platforms.
Reading the Clusters
A completed cluster chart — whether produced manually or by an automated tool — typically shows a grid or matrix with colored blocks indicating which matches cluster together. The number of clusters varies considerably: some researchers have 18 to 40 clusters depending on which platform’s data is used and the tool applied.
Interpreting the clusters begins with what you already know. Identify any clusters that contain known relatives — a cousin you already recognize, a match whose tree you can see and verify. Once you’ve anchored one cluster to a specific grandparent line, every other match in that cluster likely connects through the same line. This is particularly useful for identifying which side of the family an unknown match comes from — maternal or paternal, and often more specifically which grandparent.
AutoTree and AutoPedigree tools from Genetic Affairs go further, using the clusters as input for automated tree reconstruction, finding common ancestors across the trees of your clustered matches and suggesting where unknown individuals might fit in your family structure.
Limitations and Caveats
Endogamy. Clustering works best when ancestral lines are genuinely distinct — when your four grandparent lines come from different communities that didn’t intermarry. When ancestral lines overlap, as they frequently do in populations with a history of endogamy (Jewish families, certain Anabaptist communities, geographically isolated populations), matches can appear in multiple clusters simultaneously and the four-cluster model breaks down. The result is more clusters, with more overlap between them, and more interpretive ambiguity.
Small or absent trees. Clustering identifies groups of related matches; it doesn’t tell you what that relationship is. Without some matches in each cluster having usable family trees, the genealogical interpretation requires documentary research.
Database size effects. Clustering works better with larger match databases. On platforms with smaller databases, some ancestral lines may produce no clusters at all — not because the relationships don’t exist, but because no one on that line has tested on that platform.
For Dillman Researchers
The clustering technique has specific implications for Dillman surname research that are worth understanding before beginning. The Dillman surname covers dozens of unrelated family groups who share a surname and, frequently, German regional origins. Multiple unrelated Dillman lines descending from the same region of Hesse or Baden may share small amounts of DNA by chance — the product of distant common ancestry in a geographically limited population rather than any specific documented relationship.
This means that a Dillman researcher who uses clustering may find some clusters that appear to group Dillman matches together but actually reflect shared regional German ancestry rather than a specific Dillman family line. The chromosome browser and segment triangulation techniques covered in the previous article in this series are the appropriate tools for distinguishing these cases — clustering identifies the groups, but documentary and segment-level analysis is still required to interpret what those groups actually mean.
Used with that caveat in mind, clustering is a powerful first step for any Dillman researcher confronting a large match list. It organizes the problem into a workable structure and makes visible the patterns that would otherwise remain hidden in an undifferentiated list of names and centimorgan values.
Sources
Leeds, Dana. “The Leeds Method.” DanaLeeds.com. Accessed August 2026. danaleeds.com/the-leeds-method/.
Leeds, Dana. “DNA Color Clustering: The Leeds Method for Easily Visualizing Matches.” DanaLeeds.com. January 20, 2026. danaleeds.com.
Estes, Roberta. “How to Use Ancestry’s New Match Clusters and What They Mean.” DNAeXplained. July 10, 2025. dna-explained.com.
Elder, Diana and Nicole Dyer. “Fast Ways to Cluster Your DNA Matches at the Beginning of a Research Project.” Family Locket. familylocket.com.
GEDmatch. “Manual DNA Clustering: Step-by-Step Guide.” GEDmatch Blog. August 12, 2025. gedmatch.com.
Note: This post was researched and written with the assistance of artificial intelligence (AI). All content has been reviewed for accuracy as of August 2026. All errors are the responsibility of the author.
Discover more from Dillman Family Association
Subscribe to get the latest posts sent to your email.