
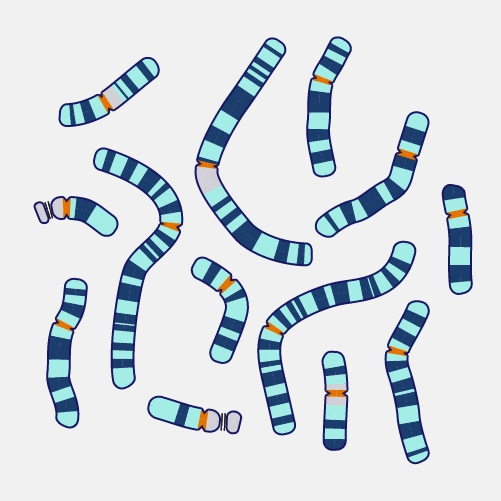
Image: Chromosome spread illustration courtesy of the National Human Genome Research Institute (NHGRI). As a work of the U.S. federal government, this image is in the public domain.
If you have spent any time looking at your DNA match list, you have seen the centimorgan (cM) figure alongside each match — a number that tells you how much DNA you share with that person. You may have a general sense that higher cM values mean closer relationships and lower values mean more distant ones. But the full picture is considerably more nuanced than that, and understanding it properly makes you a significantly more effective genetic genealogist. CentimMorgans are not a simple relationship calculator — they are a probabilistic tool with wide ranges, significant overlap between relationship types, and important limitations that every intermediate researcher needs to internalize.
This article explains what centimorgans are, how they are measured, what the typical ranges look like for common genealogical relationships, why the same cM amount can indicate multiple different relationships, and how to use the Shared cM Project and DNA Painter to interpret your matches effectively.
What Is a Centimorgan?
A centimorgan is a unit of genetic distance — specifically, a measure of the probability that two locations on a chromosome will be separated by recombination during the formation of eggs or sperm. The unit is named after Thomas Hunt Morgan, the American geneticist who won the Nobel Prize in Physiology or Medicine in 1933[1] for his work on chromosomal inheritance.
One centimorgan represents a 1% chance that two genetic markers will be separated from each other during meiosis — the cell division process that produces eggs and sperm. In practical terms, one centimorgan corresponds to approximately one million base pairs of deoxyribonucleic acid (DNA), though the relationship between physical length and centimorgan value varies across the genome because recombination happens more frequently in some regions than others. This means centimorgans measure genetic distance — the likelihood of segments staying together across generations — not physical distance along the chromosome.
For genealogists, the practical meaning of a centimorgan is simpler: it is a unit for measuring how much DNA two people share. The more centimorgans two people share, the more DNA they have inherited from the same ancestor — and, in general, the more recently that common ancestor lived. The human autosomal genome spans approximately 6,800 centimorgans in total across all 22 chromosome pairs, though testing companies typically report shared DNA within a range of approximately 6,700–7,100 cM for a parent-child relationship, depending on the platform.
How Centimorgans Are Measured
When you take an autosomal DNA test, the testing company reads your single nucleotide polymorphisms (SNPs) — specific positions across your genome where the DNA sequence commonly varies between individuals. When two people share a long, unbroken stretch of identical SNPs on the same chromosome, that stretch is called a shared segment, and its length is measured in centimorgans.
Testing companies set a minimum threshold for reporting matches — typically around 6–8 cM for a single shared segment, though this varies by platform and has changed over time. Segments below this threshold may be too small to reliably indicate recent shared ancestry, as opposed to ancient population-level sharing (known as identical by population, or IBP) that does not reflect a genealogically meaningful relationship. The total shared cM figure reported for a match is the sum of all shared segments above the minimum threshold across all chromosomes.
One important technical note: not all testing companies include X-chromosome DNA in their reported cM totals. FamilyTreeDNA (FTDNA) reports X-DNA matches separately from autosomal matches, so the total cM shown in the match list does not include any X-chromosome sharing. AncestryDNA does include the X chromosome in its total cM figure. This means that the same two people may appear to share slightly different amounts of DNA at different companies — not because the tests disagree, but because they are measuring and reporting slightly different things.
📊 What the Numbers Mean: Key Relationship Ranges
The following ranges represent typical observed values from the Shared cM Project version 4.0 — the most comprehensive dataset of known relationships and shared cM values ever assembled, based on more than 60,000 submissions from the genetic genealogy community. These are observed ranges, not theoretical values — they reflect real variation in how DNA is actually inherited. Every range has exceptions at its extremes, and the ranges for more distant relationships overlap substantially with each other.
- Parent / Child: ~3,330–3,720 cM (average ~3,500 cM).[2] The most consistent relationship — a parent always passes exactly 50% of their DNA to each child, making this one of the tightest ranges in the table.
- Full Siblings: 1,613–3,488 cM (average ~2,613 cM). The wide range reflects the randomness of which chromosomal segments each sibling inherited from each parent.
- Half Siblings: 1,160–2,650 cM (average ~1,759 cM). Note that the upper end of the half-sibling range overlaps substantially with the full sibling range — a half-sibling can share as much DNA as some full siblings.
- Grandparent / Grandchild: 984–2,462 cM (average ~1,754 cM).
- Aunt or Uncle / Niece or Nephew: 1,201–2,282 cM (average ~1,740 cM). Nearly identical average to grandparent/grandchild — these relationships cannot be distinguished by cM alone.
- First Cousins: 553–1,225 cM (average ~850 cM).
- First Cousins Once Removed (1C1R): 141–851 cM (average ~435 cM).
- Second Cousins: 41–592 cM (average ~229 cM).
- Second Cousins Once Removed (2C1R): 0–316 cM (average ~122 cM).
- Third Cousins: 0–173 cM (average ~74 cM). Note the range begins at zero — some third cousins share no detectable DNA at all.
- Fourth Cousins: 0–139 cM (average ~35 cM). The majority of fourth cousins share less than 50 cM, and a significant proportion share nothing detectable.
These ranges make clear what experienced genetic genealogists know well: for close relationships (parent, child, full sibling), shared cM values are highly informative and largely unambiguous. For relationships at the second cousin level and beyond, the ranges widen dramatically and overlap with multiple other relationship types, making cM alone an unreliable guide to the specific relationship.
The Fundamental Problem: One Number, Many Relationships
The most important concept for intermediate genealogists to internalize is that the same cM amount is consistent with multiple different genealogical relationships — and that ambiguity increases sharply as the shared amount decreases.
Consider a match sharing 200 cM with you. Plugging that value into the Shared cM Project tool at DNA Painter (dnapainter.com/tools/sharedcm) reveals that 200 cM is consistent with — among others — second cousin, second cousin once removed, first cousin three times removed, half second cousin, and several other more complex relationships. No amount of additional cM data can distinguish between these possibilities; that requires documentary genealogical research.
This relationship ambiguity is not a flaw in the testing — it is a mathematical consequence of how DNA is inherited. Recombination is random, which means the amount of DNA any two relatives share varies considerably around the expected average. Two second cousins might share 450 cM while another pair of second cousins shares only 85 cM — both are real second cousins, but their shared cM values would suggest very different relationships if interpreted without context.
Several factors can further complicate cM interpretation:
Endogamy — in populations where intermarriage within the same community was common across many generations, DNA matches tend to share more cM than their documentary relationship would predict, because they are related through multiple pathways simultaneously. Ashkenazi Jewish genealogy is the most commonly cited example, but the same effect applies to other historically endogamous populations, including some 18th-century German religious communities.
Pedigree collapse — when two people share common ancestors on more than one branch of their family trees (because their families intermarried in previous generations), their shared cM total will be higher than a single relationship path would predict. This can make a more distant relationship appear closer than it actually is through any single genealogical line.
Half relationships — half-siblings, half-first cousins, and other half relationships share approximately half the DNA of their full equivalents, but their ranges overlap with the full equivalents of more distant relationships, creating systematic ambiguity that cannot be resolved without additional information.
The Shared cM Project: The Essential Reference Tool
The Shared cM Project was initiated in 2015[3] by Blaine Bettinger, one of the most respected voices in genetic genealogy and author of The Family Tree Guide to DNA Testing and Genetic Genealogy. Bettinger invited the genealogy community to submit verified relationship pairs along with their shared cM values, building a crowdsourced dataset of real-world observations that has grown to over 60,000 submissions[4] in its most recent version (4.0, released March 2020).
The project’s data underpins the interactive Shared cM tool at DNA Painter, built by developer Jonny Perl, which is the most widely used relationship interpretation tool in genetic genealogy. To use it: enter the cM amount you share with a match, and the tool returns a probability distribution across all possible relationships — showing not just which relationships are possible, but how likely each one is given the specific cM value. Probability calculations in the current tool are based on statistical analysis by Dr. Leah Larkin[5] (The DNA Geek), and the tool is continuously refined as the dataset grows.
The DNA Painter Shared cM tool is available free at dnapainter.com/tools/sharedcm and should be bookmarked by every active DNA researcher. It is, simply, the most useful single tool available for interpreting DNA match relationships.
Using CentimMorgans Effectively: A Practical Workflow
Knowing the theory is one thing; applying it productively to your match list is another. A practical workflow for using cM data in your research:
Start with the DNA Painter tool. For any significant match, enter the shared cM value and review the probability distribution. Note which relationships are most likely and which can be ruled out based on the cM value alone.
Apply age and generation constraints. If you know the approximate birth year of your match, use that information to eliminate impossible relationships from the DNA Painter results. A match born in 1945 cannot be your first cousin once removed if all your first cousins were born after 1960 — the generational math rules it out regardless of what the cM value suggests.
Use shared matches to triangulate. Which other people do you and this match both share? If your match shares DNA with several of your known second cousins on your maternal grandfather’s side, you have strong evidence that the match connects through that branch — regardless of what the raw cM value suggests about the specific relationship.
Consult ThruLines or equivalent tools. AncestryDNA’s ThruLines and similar hypothesis-generating tools at other platforms can propose specific ancestral connections that give you a documentary research target — which you then verify against primary sources.
Accept the ambiguity for distant matches. For matches below 100 cM, accept that you may never be able to determine the specific relationship from DNA alone. These matches are still useful — they confirm that a connection exists through a specific branch of your tree, and they may eventually help you extend a line through collaborative research — but do not invest significant time trying to resolve their precise relationship from cM data.
What This Means for Dillman Researchers
For Dillman Family Association (DFA) members using DNA to extend or confirm Dillman family lines, understanding centimorgans is directly applicable. When a new match appears sharing, say, 175 cM, the DNA Painter tool will tell you that this amount is most consistent with second cousin, second cousin once removed, first cousin three times removed, or half second cousin — among other possibilities. Your job is then to use shared match analysis, ThruLines hypotheses, and documentary research to determine which of those possibilities applies to your specific Dillman line.
For researchers contributing to the Dillman DNA Project, recording not just the existence of DNA matches but their specific cM values — and the relationship conclusions reached through documentary verification — builds a progressively more useful database of confirmed Dillman genetic relationships that benefits every researcher working on those lines.
The Shared cM Project version 4.0 (March 2020) is the current edition, based on over 60,000 community-submitted relationship pairs. The interactive Shared cM tool, incorporating probability analysis by Dr. Leah Larkin, is available free at dnapainter.com/tools/sharedcm. CentimMorgan ranges cited in this article are drawn from Shared cM Project 4.0 data. Individual results will vary; these ranges represent observed real-world variation, not theoretical values.
Sources
- Nobel Prize Organisation, “Thomas Hunt Morgan — Facts,” nobelprize.org (accessed May 2026).
- ISOGG Wiki, “Autosomal DNA statistics,” isogg.org/wiki/Autosomal_DNA_statistics (accessed May 2026).
- Blaine Bettinger, “The Shared cM Project,” The Genetic Genealogist, 2015, thegeneticgenealogist.com (accessed May 2026).
- Blaine Bettinger, “The Shared cM Project 4.0,” March 2020, thegeneticgenealogist.com (accessed May 2026).
- DNA Painter, “Shared cM Tool,” dnapainter.com/tools/sharedcm (accessed May 2026).
AI Disclosure: This article was researched and written with the assistance of Claude, an AI assistant developed by Anthropic. All facts have been reviewed for accuracy, but readers are encouraged to verify information independently, particularly for time-sensitive details such as cM range data and tool availability.
Discover more from Dillman Family Association
Subscribe to get the latest posts sent to your email.